SCO Support Chain Optimisation
SCO Support Chain Optimisation ist ein Gesamtkonzept von Softwaretools mit einer zentralen Datenbasis (TFD Data Vault).
Diese ist im Grunde ein PDM System, in dem alle relevanten Daten vom Design an bis hin zum Ersatzteilmanagement gesammelt werden.
Es ist eine relationale Datenbank, die sowohl den MIL-STD-1388-2A und 2B als auch den DEF-STD-0060 abbildet. Mit der Software-Applikation TDX können die Daten erfasst und verwaltet werden.
Wie Bausteine fügen sich Tools für strategische Planung und Tools für Auswertung, Überwachung und Steuerung des operativen Tagesgeschäfts zu einem Gesamtsystem "System Support".
Die neueste Entwicklung ist die Anbindung von Daten für die IETD nach ASD 1000D (früher AECMA 1000D) und ASD 2000M.
TFD unterscheidet die Verwaltung und Verarbeitung von Daten im Logistic Process Management mit einer Reihe von Tools für den logistischen Aufgabenbereich einerseits und andererseits den Bereich der Strategischen Planung.
Diese strategische Planung beinhaltet die Unterstützung von Entscheidungsprozessen,
- zum einen bezüglich der rationalen, wirtschaftlichen Gestaltung des
Materialerhaltungskonzeptes (MEK) mit der
LORA Level of Repair Analyse,
- zum anderen Entscheidungshilfen zur optimalen Ersatzteilbevorratung mit VARIMetric,
- und schließlich mit Hilfe von MAAP, einem LCC/TOC System die Modelliering der Kosten (LCC Lebenszykluskosten bzw. TOC Total Ownership Costs) der Systemnutzung.
Im operativen Bereich (Logistic Process Management) werden aus den beim Kunden im Einsatz befindlichen Warenwirtschafts- und Lagerhaltungssystemen (wie z.B. SAP) Daten herausgefiltert und daraus Kennzahlen aufbereitet.
Diese Auswertungen z.B.über
- Lieferverzögerungen,
- zu späte Bestellzeitpunkte oder
- tatsächlich erreichte Reparaturdurchlaufzeiten
werden in die "Strategischen Tools" zurückgegeben für eine neue Planung auf der Grundlage von realistischen Werten.
Die Grundidee ist, einmal gewonnene Daten für die verschiedensten Fragestellungen und Softwaretools zur Verfügung zu stellen:
Enter once - use multiple.
Insgesamt ist das ein Optimierungssystem für die Systemunterstützung, das auch die Simulation von Einsatzszenarien auf der Basis von realen Daten ermöglicht. Es können verschieden Modelle für die Systemunterstützung entwickelt und gespeichert werden, und es können Auswirkungen von Änderungen sichtbar gemacht werden, vor allem hinsichtlich der Lebenszykluskosten.
In diesem Optimierungssyste ist auch ein Asset Tracking System eingebaut, siehe die nachfolgende Beschreibung der Bausteine.
Kurze Erklärung der Bausteine in Englisch:
(TFDdB = TFD Data Base)
ULRS: Universal LSA Recording System
It can be a 1-standard LSAR system or a multiple standard (normalized database across standards) system. Either the user can enter all the required data gathered from other sources or he can do what the original standard was aimed at perform real analysis with our tools, augment the result with whatever additional data are required by a particular customer and generate an output according to that customers favored standard. The first release will have MIL-STD-1388-2B, -2B, Notice 1, DEF STAN 00-60 Issues 1, 2, 4 and 5. Later well add the Australian Defense Force extensions to 2B,1 and a couple of other wrinkles.
TDX:This is the really important accomplishment
This is a collection of managers like Structure Manager whose job it is to provide a user interface to the maintenance of groups of tables in the TFDdB. They are modular, all written in VB.net, data dictionary-driven, client-server, with web capability where applicable. As a product, TDX is used to maintain the TFDdB. The RAF still uses this and the British Army have recently acquired it as well. Beyond the data maintenance function, however, TDXs modules are the building blocks for all the other software. The version 4 suite of software will all be built from these modules. Not only will everything look and work the same way, but the cost of maintenance should go down significantly and well be able to bring new products to market much more quickly like a revised SDU.
(Ao = operational Availability)
mBrace and mBoss: These are modules for MAAP that turn it into a multi-resource optimization model.
From mBoss you get an output Ao-for-cost function that looks the same as the one from VMetric, but is comprised of all different types of resources parts, tools, facilities, skilled people, software, training courses, fuel etc. That is based on the output of a conventional MAAP run (which itself is based on the standard assumption of infinite resources, therefore requiring no stocks, only pipeline quantities). This analysis is most useful if no resources have actually been acquired yet. You can simply run up and down the curve, which is the locus of all optimal solutions, and choose the solution that fits your needs and pocket book.
mBrace takes this a step further and provides a budget manager with the tools he needs to start from his current position (whether optimal or sub-optimal) and respond to any budget cut in the least damaging way.
SCO Support Chain Optimization
This name is for a collection of software elements that, taken together, can perform interesting and valuable new functions in an inventory management environment. They can be bolted on to any inventory management system or we can supply most of the asset management functions as well (through the South African firm).
The paper on the concept of Autonomic Logistic Analysis gives you some of the background and a briefing you can work your way through.
---> (available for download from this web-page for registrated users).
The overall idea is this: fixed stock parameters (stock level, re-order point and order quantity) are only good if the underlying phenomena influencing demands and delays are almost perfectly constant. Even in those circumstances, the steady-state solution generally performs less well than we anticipate. In SCO, we use short-to-medium-term simulation analysis to make dynamic adjustments in the stock parameters on a day by day basis. By doing so, we can anticipate, for example, reductions in demands during lead time and stall the next order by simply lowering the re-order point from one day to the next. If trouble starts to brew up on that part later, the re-order point can be raised again. Each simulation takes into account a wealth of detail such as the known and guessed at schedule for that part during the coming term (dues-in from multiple orders, tests, likelihood of test failure, arrival of periodic demands and the like). A series of simulations are run varying the stock parameters and interpreting the implied changes in expected back orders in monetary terms, according to the contractual schedule of incentives or penalties associated with back order performance. The result can be thought of as a graph relating the increasing cost of inventory as reorder points are raised, to the decreasing cost of forgone revenues from incentive fees (sorry for that the curve is the complement of the increased earned fee resulting from lower expected back orders). A vertical sum of these two cost functions they look just like O&S and Acquisition curves plotted against increasing reliability is U-shaped and the lowest point marks the optimal re-order point for that part. Now we consolidate that result across all parts in inventory and can order the required changes (raising and lowering reorder points) in decreasing value of change in fee per unit of cost.
The components of the SCO system are:
TFD Data Vault
This is what we now call the data repository that includes a number of databases including the TFDdB, an asset management database, an LSAR database, a data warehouse and a customer-specific region. The essential elements of the SCO system include all but the LSAR region. In the data warehouse we perform two functions: we archive the transactions from the asset management system and we store time series data derived from the transactions streams.
T3S: Transactions to Time Series
This module matches receipts to orders and compiles time series of demands and delays. Delay times can be trapped for any subsets of total delays the information system is capable of distinguishing, such as administrative delay time, order and ship time, repair cycle time, procurement lead time or any of the sub-sets of those measures. These time series become the inputs to the next module, FPM.
FPM: Forecast and Performance Measurement
Forecast and Performance Measurement is the module that uses the time series data generated by T3S. The purpose of the module is to develop estimates for demand rates and delay times. It is also measuring variance to mean ratios and trends. These results are used to refresh the static data included in the TFDdB, used for modeling. The delay time forecasts are the performance measurement part of this module, which is an allusion to the performance of vendors of either parts or repairs. These data become vital in the simulation analysis I mentioned above, since they can take account of variations in vendor performance in developing the optimal re-order point.
TORQ: Tactical Optimal Reorder Point and Order Quantity
This is the piece that performs the simulation analyses I explained above, consolidates them and passes the results to the asset managers. This and the two previous software modules above lack any user interface. The reason they are modularized is a) for purposes of exposition and b) to allow any customer to substitute for any or all of these individual functions rather than buying them from us.
TAMS: Tactical Asset Managers System
This is the software that each item manager would use to control the inventory of a family of parts. It provides a large number of functions such as prioritization of problem parts (back orders and imminent back orders), analytical functions like simulation processes that the IM can play with to see what effect various measures will have, vendor appraisals (the performance measurement results from above), override capability for automatically generated stock parameter changes, complete technical library detail for each part and so on.
When you put all this together and start operating it, you get a number of things. We can demonstrate how much better the inventory result is than conventional methods even those that include periodic re-optimization with steady state models like VMetric. A really interesting side effect, though, is a continuously updated analytical database. It means that every time someone asks for an analysis of some sort, he can get his result in something like 1/10th to 1/20th of the time it would normally take. You still need VMetric (or something like it) to perform episodic re-optimization rather than periodic re-optimization. That is, you need a new starting place for the stock parameters when a significant shock occurs to the system increase in fleet size, significant hardware changes like mid-life upgrades, changes in operating times, new bases, changing hubs and so on. Finally, if you also have models like EDCAS and MAAP attached to the database, you can continually revisit such things as repair policies and budget estimates.
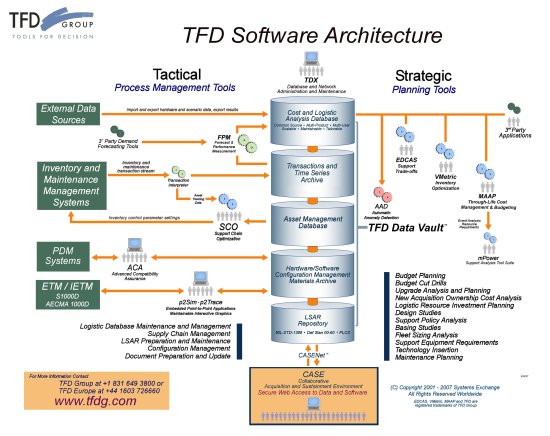
Support Chain Optimization (Illustration)
Die Illustration mit Begleittext finden Sie auch unter Home/Download.
Support Chain Optimisation(PDF)
Support Chain Optimisation - Begleittext(PDF)